Reminiscence has always been a large part of the art that defines our culture. H.G. Wells, Edgar Allen Poe and Mark Twain all wrote definitive stories in the 19th century about nostalgia and the mystery of the distant past. Think time travel movies such as Back To The Future or Peggy Sue Got Married, classic 80s flicks that idolise the 60s. Most recently, Stranger Things renewed a cultural interest in 80s creature features, neon lights and synthwave soundtracks and vapourwave, a musical subculture sometimes associated with 80s consumer capitalism, became popular in 2015. It seems to be in our nature to always sentimentally look backwards at how things used to be – a sort of safe place and retreat from our realities. Whereas philosophers such as Mark Fisher called this obsession “hauntology”, which carries implications of an eschatological omen, others see a Shangria-La of endearing, bygone media that doesn’t haunt but has the breeze of a fond memory.
Static Rerun, AKA Matt Stetson, runs an Instagram archive with the mission objective of “recreating, reliving and rewinding back to the 80s and 90s” through impressively curated objects of the past. “I just want to create something that will instantly transform the viewer to a warm memory or happier time,” says Matt. His highly designed videos appear more like set pieces than the typical archival page, with a ton of thought put into the construction of the image and the relation between the presented media. “Ever since I was little I’ve been obsessed with themed calendars and books like I Spy and they have definitely influenced what I do in my photography,” says Matt. Influences of wimmelbooks (wordless picture books filled with detailed scenes) and spotters’ guides make sense – artefacts of the time give viewers visual clues on the specific era; Vanilla Ice, Super Mario World and bottles of the rare Crystal Pepsi take the viewer to the early 90s, whereas E.T, Big and Rambo take us to the 80s. It’s like Where’s Wally, but one that involves your own childhood.
For many, the 80s and 90s won’t be their idea of childhood. Nowadays, revivals of fashion trends and emerging internet aesthetics are flavoured primarily by the noughties and 2010s. But for Matt, staying true to his own personal history is important. “My biggest influence would have to be my father, whom we lost in 2017,” says Matt. “Once he passed I felt an obligation to chase my creativity to show him honor and as a thank you for everything he gave up for me.” Perhaps why nostalgia prevails so much in our culture is because it is our nostalgia, our own personalised and untouchable feeling. When Matt creates cathedrals of Gen-X memorabilia, he transforms it from clutter to curio, from trash to testimonial. “It doesn’t hurt that the 80s and 90s were easily the best two decades to grow up,” says Matt.
Google’s John Mueller used a clever technique to show the publisher of an educational site how to diagnose their search performance issues, which were apparently triggered by a domain migration but were actually caused by the content.
Someone posted a plea for help on the Bluesky social network to help their site recover from a site migration gone wrong. The person associated with the website attributed the de-indexing directly to the site migration because there was a direct correlation between the two events.
SEO Insight
An interesting point to highlight is that the site migration preceded the de-indexing by Google but it’s not the cause. The site migration is not the cause for the de-indexing. The migration is what set a chain of events into action that led to the real cause, which as you’ll see later on is low quality content. A common error that SEOs and publishers make is to stop investigating upon discovering the most obvious reason for why something is happening. But the most obvious reason is not always the actual reason, as you’ll see further on.
This is what was posted on social media:
“Hello SEO Community,
Sudden Deindexing & Traffic Drop after Domain Migration (from javatpoint.com to tpointtech.com) – Need Help”
Google’s John Mueller answered their plea and suggested they do a site search on Bing with their new domain, like this:
site:tpointtech.com sexy
And when you do that Bing shows “top ten list” articles about various Indian celebrities.
Google’s John Mueller also suggested doing a site search for “watch online” and “top ten list” which revealed that the site is host to scores of low quality web pages that are irrelevant to their topic.
A screenshot of one of the pages shows how abundant the off-topic web pages are on that website:
The irrelevant pages originated from the original domain, Javatpoint.com, from which they migrated. When they migrated to Tpointtech they also brought along all of that low quality irrelevant content as well.
Here’s a screenshot of the original domain, demonstrating that the off-topic content originated on the old domain:
Google’s John Mueller posted:
“One of the things I noticed is that there’s a lot of totally unrelated content on the site. Is that by design? If you go to Bing and use [site:tpointtech.com watch online], [site:tpointtech.com sexy], [site:tpointtech.com top 10] , similarly probably in your Search Console, it looks really weird.”
See also: What to Do About Old Low Quality Content
Bing Is Useful For Site Searches
Google’s John Mueller showed that Bing can be useful for identifying pages that Google is not indexing which could then indicate a content problem.
SEO Insight
The fact that Bing continues to index the off topic content may highlight a difference between Google and Bing. The domain migration might be showing one of the ways that Google identifies the motivation for content, whether the intent is to rank and monetize rather than create something useful to site visitors. An argument could be made that the wildly off-topic nature of the content betrays the “made-for-search-engines” motivation that Google cautions against.
Irrelevant Content
A site generally has a main topic, with branching related subtopics. But in general the main topic and subtopics relate to each other in a way that makes sense for the user. Adding wildly off-topic content low quality content betrays an intent to create content for traffic, something that Google explicitly prohibits.
Past Performance Doesn’t Predict Future Performance
There’s a tendency on the part of site publishers to shrug about their content quality because it seems to them that Google likes it just fine. But that doesn’t mean the content is fine, it means that it hasn’t become an issue yet. Some problems are dormant and when I see this in site reviews and generally say that this may not be a problem now but it could become a problem later so it’s best to be proactive about it now.
Given that the search performance issues occurred after the site migration but the irrelevant content was pre-existing it appears that the effects of the irrelevant content were muted by the standing the original content had. Nevertheless the irrelevant content was still an issue, it just hadn’t hatched into an issue yet. Migrating the site to a new domain forced Google to re-evaluate the entire site and that’s when the low quality content became an issue.
Content Quality Versus Content Intent
It’s possible for someone to make a case that the content, although irrelevant, was high quality and shouldn’t have made a difference. What calls attention to me is that the topics appear to signal an intent to create content for ranking and monetization purposes. It’s hard to argue that the content is useful for site visitors to an educational site.
Expansion Of Content Topics
Lastly there’s the issue of whether it’s a good idea to expand the range of topics that a site is relevant for. A television review site can expand to include reviews of other electronics like headphones and keyboards and it’s especially smoother if the domain name doesn’t set up the wrong expectation. That’s why domains with the product types in them are so limiting because they presume the publisher will never achieve so much success that they’ll have to expand the range of topics.
See also: Site Migration Issues: 11 Potential Reasons Traffic Dropped
Featured Image by Shutterstock/Ollyy
MarTechCharts regularly highlights data of interest to marketers and marketing operations professionals.
When measured by conversion rate, the average AI search visitor (tracked to a non-Google search source like ChatGPT) is 4.4 times as valuable as the average visit from traditional organic search, according to research by Semrush. (Semrush is parent company of MarTech publisher Third Door Media.)
Semrush predicts that as AI search grows (and traditional search declines) for websites over time, AI channels will drive similar amounts of economic value globally by the end of 2027 and potentially grow far beyond that in later years.
When it comes to conversions, the visitors from AI search show up at websites with a wealth of information supplied by their LLMs. That makes them more prepared to make a purchase decision.
The post Average LLM visitor worth 4.4x organic search visitors appeared first on MarTech.

Designing for other creatives has got to be one of the hardest tasks out there. It’s a challenge we took on last year when rebranding our very own Brand Impact Awards, and in 2025, JKR has created a new identity for one of the biggest events of the design year, D&AD Awards and Festival.
Everywhere you went at D&AD Festival and Awards, you were surrounded by riffs on the idea of Drawn to Create. The identity centres around the iconic Pencil (how could it not?) and a bold new typeface created with Studio DRAMA, Pencil Gothic. The typeface and identity morphed into different shapes on stage, lent itself to signage, backdrops and was front and centre of the glitzy awards ceremony.
You may like
The new AI Mode tab in Google’s results, currently only active in the U.S., enables users to get an AI-generated answer to their query.
You can ask a detailed question in AI Mode, and Google will provide a summarized answer.
Google AI Mode answer for the question [what are the best ways to grow your calf muscles], providing a detailed summary of exercises and tips (Image Credit: Barry Adams)
Google explains how it generates these answers in some recently published documentation.
The critical process is what Google calls a “query fan-out” technique, where many related queries are performed in the background.
The results from these related queries are collected, summarized, and integrated into the AI-generated response to provide more detail, accuracy, and usefulness.
Having played with AI Mode since its launch, I have to admit it’s pretty good. I get useful answers, often with detailed explanations that give me the information I am looking for. It also means I have less need to click through to cited source websites.
I have to admit that, in many cases, I find myself reluctant to click on a source webpage, even when I want additional information. It’s simpler to ask AI Mode a follow-up question rather than click to a webpage.
Much of the web has become quite challenging to navigate. Clicking on an unknown website for the first time means having to brave a potential gauntlet of cookie-consent forms, email signup pop-ups, app install overlays, autoplay videos, and a barrage of intrusive ads.
The content you came to the page for is frequently hidden behind several barriers-to-entry that the average user will only persist with if they really want to read that content.
And then in many cases, the content isn’t actually there, or is incomplete and not quite what the user was looking for.
AI Mode removes that friction. You get most of the content directly in the AI-generated answer.
You can still click to a webpage, but often it’s easier to simply ask the AI a more specific follow-up question. No need to brave unusable website experiences and risk incomplete content after all.
Contrary to AI Overviews, AI Mode will provide summaries for almost any query, including news-specific queries:
AI Mode answer for the [latest news] query (Image Credit: Barry Adams)
Playing with AI Mode, I’ve seen some answers to news-specific queries that don’t even cite news sources, but link only to Wikipedia.
For contrast, the regular Google SERP for the same query features a rich Top Stories box with seven news stories.
With these types of results in AI Mode, the shelf life of news is reduced even further.
Where in search, you can rely on a Top Stories news box to persist for a few days after a major news event, in AI Mode, news sources can be rapidly replaced by Wikipedia links. This further reduces the traffic potential to news publishers.
A Google SERP for [who won roland garros 2025] with a rich Top Stories box vs. the AI Mode answer linking only to Wikipedia (Image Credit: Barry Adams)
There is some uncertainty about AI Mode’s traffic impact. I’ve seen examples of AI Mode answers that provide direct links to webpages in-line with the response, which could help drive clicks.
Google is certainly not done experimenting with AI Mode. We haven’t seen the final product yet, and because it’s an experimental feature that most users aren’t engaged with (see below), there’s not much data on CTR.
As an educated guess, the click-through rate from AI Mode answers to their cited sources is expected to be at least as low, and probably lower, as the CTR from AI Overviews.
This means publishers could potentially see their traffic from Google search decline by 50% or more.
The good news is that user adoption of AI Mode appears to be low.
The latest data from Similarweb shows that after an initial growth, usage of the AI Mode tab on Google.com in the U.S. has slightly dipped and now sits at just over 1%.
Data courtesy of Similarweb and Aleyda Solis (Image credit: Barry Adams)
This makes it about half as popular as the News tab, which is not a particularly popular tab within Google’s search results to begin with.
It could be that Google’s users are satisfied with AI Overviews and don’t need expanded answers in AI Mode, or that Google hasn’t given enough visual emphasis to AI Mode to drive a lot of usage.
I suspect that Google may try to make AI Mode more prominent, with perhaps allowing users to click from an AI Overview into AI Mode (the same way you can click from a Top Stories box to the News tab), or integrate it more prominently into their default SERP.
When user adoption of AI Mode increases, the impact will be keenly felt by publishers. Google’s CEO has reiterated their commitment to sending traffic to the web, but the reality appears to contradict that.
In some of their newest documentation about AI, Google strongly hints at diminished traffic and encourages publishers to “[c]onsider looking at various indicators of conversion on your site, be it sales, signups, a more engaged audience, or information lookups about your business.”.
Broad adoption of AI Mode, whatever form that may take, can have several impactful consequences for web publishers.
Worst case scenario, most Google search traffic to websites will disappear. If AI Mode becomes the new default Google result, expect to see a collapse of clicks from search results to websites.
Focusing heavily on optimizing for visibility in AI answers will not save your traffic, as the CTR for cited sources is likely to be very low.
In my view, publishers have roughly three strategies for survival:
Google’s Discover feed may soften the blow somewhat, especially with the rollout onto desktop Chrome browsers.
Expanded presence of Discover on all devices with a Chrome browser gives more opportunities for publishers to be visible and drive traffic.
However, a reliance on Discover as a traffic source can encourage bad habits. Disregarding Discover’s inherent volatility, the unfortunate truth is that clickbait headlines and cheap churnalism do well in the Discover feed.
Reducing reliance on search in favor of Discover is not a strategy that lends itself well to quality journalism.
There’s a real risk that, in order to survive a search apocalypse, publishers will chase after Discover clicks at any cost. I doubt this will result in a victory for content quality.
Publishers need to grow traffic and income from more channels than just search. Due to Google’s enormous monopoly in search, diversified traffic acquisition has been a challenge.
Google is the gatekeeper of most of the web’s traffic, so of course we’ve been focused on maximising that channel.
With the risk of a greatly diminished traffic potential from Google search, other channels need to pick up the slack.
We already mentioned Discover and its risks, but there are more opportunities for publishing brands to drive readers and growth.
Paywalls seem inevitable for many publishers. While I’m a fan of freemium models, publishers will have to decide for themselves what kind of subscription model they want to implement.
A key consideration is whether your output is objectively worth paying for. This is a question few publishers can honestly answer, so unbiased external opinions will be required to make the right business decision.
Podcasts have become a cornerstone of many publishers’ audience strategies, and for good reason. They’re easy to produce, and you don’t need that many subscribers to make a podcast economically feasible.
Another content format that can drive meaningful growth is video, especially short-form video that has multiplatform potential (YouTube, TikTok, Instagram, Discover).
Email newsletters are a popular channel, and I suspect this will only grow. The way many journalists have managed to grow loyal audiences on Substack is testament to this channel’s potential.
And while social media hasn’t been a key traffic driver for many years, it can still send significant visitor numbers. Don’t sleep on those Facebook open graph headlines (also valuable for Discover).
The third strategy, and probably the most important one, is to build a strong publishing brand that is actively sought out by your audience.
No matter the features that Google or any other tech intermediary rolls out, when someone wants to visit your website, they will come to you directly. Not even Google’s AI Mode would prevent you from visiting a site you specifically ask for.
A brand search for [daily mail] in Google AI Mode provides a link to the site’s homepage at the top of the response (Image credit: Barry Adams)
Brand strength translates into audience loyalty.
A recognizable publisher will find it easier to convince its readers to install their dedicated app, subscribe to their newsletters, watch their videos, and listen to their podcasts.
A strong brand presence on the web is also, ironically, a cornerstone of AI visibility optimization.
LLMs are, after all, regurgitators of the web’s content, so if your brand is mentioned frequently on the web (i.e., in LLMs’ training data), you are more likely to be cited as a source in LLM-generated answers.
Exactly how to build a strong online publishing brand is the real question. Without going into specifics, I’ll repeat what I’ve said many times before: You need to have something that people are willing to actively seek out.
If you’re just another publisher writing the same news that others are also writing, without anything that makes you unique and worthwhile, you’re going to have a very bad time. The worst thing you can be as a publisher is forgettable.
There is a risk here, too. In an effort to cater to a specific target segment, a publisher could fall victim to “audience capture“: Feeding your audience what they want to hear rather than what’s true. We already see many examples of this, to the detriment of factual journalism.
It’s a dangerous pitfall that even the biggest news brands find difficult to navigate.
In my previous article, I wrote a bit about how to optimize for AI Overviews.
I’ll expand on this in future articles with more tips, both technical and editorial, for optimizing for AI visibility.
More Resources:
This post was originally published on SEO For Google News.
Featured Image: BestForBest/Shutterstock
Digiday covers the latest from marketing and media at the annual Cannes Lions International Festival of Creativity. More from the series →
As thousands of agency folk grab their passports, sunblock and antacids to head to Cannes next week for the annual Lions fest, Omnicom has quietly hammered out its strategy and message it’s taking to the Croisette. That message is, it’s time to capture the myriad opportunities for live — be it live-streaming, sponsorship of live sports, live shopping, etc.
Digiday has learned of a number of partnerships Omnicom and its various units (Omnicom Media Group, influencer arm Creo, commerce arm Flywheel) will be announcing next week with major platforms and retail media networks, all with an eye toward better understanding, harnessing and exploiting live opportunities for clients. Several Omnicom executives who spoke with Digiday talked of “the power of live content, conversation and commerce to drive brand growth.”
It’s all based on research Omnicom Media Group conducted that shows live can deliver more for clients thanks to evolving consumer habits and likes. Joanna O’Connell, Omnicom Media Group North America’s chief intelligence officer, spearheaded the research after OMG’s chief product officer Megan Pagliuca ID’ed the topic as one on which to focus. Nearly 1,500 U.S. consumers matched against U.S. Census data were surveyed the last week of April to generate the Rethinking Live study.
“There is truly this kind of rebound toward shared experiences,” said O’Connell. “Even as we’ve moved in a direction of so much personalization and so much … time spent alone on screens, people crave togetherness, they crave community, they crave connection. So, ‘live’ in that sense, is even more important than ever, because it’s kind of creating moments that bring people together, and they’re drawn to that.”
“At Philips, we recognize the opportunity that livestreaming and creator-led content unlock for deeper customer engagement,” said Faith Lim, ASEASN digital and media lead for Omnicom client Philips.
Some stats support Pagliuca’s hunch and O’Connell’s research as expressed in the report — which takes the concept of live far beyond live events like the Oscars or the Super Bowl, and into live-streaming, live shopping on a number of platforms (such as Amazon), second-screen experiences (such as conversations on X) while watching something live. For one, the study revealed that 75% of Gen Z watch social media live-streams while only 57% watch live TV content. In total, the live-stream e-commerce marketplace is estimated to hit almost $20 billion this year.
“When we asked people what they associate with live, more people (all U.S. consumers, not a specific age group) now say ‘live streaming on social platforms’ than they will live TV. And that’s bananas,” said O’Connell.
“Those are just massive numbers,” added Kevin Blazaitis, U.S. president of Creo, Omnicom’s influencer arm.
Three general findings came out of the research, said O’Connell. First, live-streams are the new prime time for younger people. One-third of younger respondents said they watch live-streamed content weekly, and they said it creates shared memories. What Omnicom will announce next week are a series of partnerships with a variety of platforms to harness this for clients, primarily through the influencers and creators who are live-streaming.
Secondly, co-viewing is more of a thing than ever before, particularly in the esports world. But other examples such as YouTube’s “watch with” feature adds a creator commentary layer to live sports streaming, while Thursday Night Football on Amazon also offers creator-led commentary.
Finally, private channels can’t be overlooked, since they also factor heavily into the shared experience — be it private chats, or membership in clubs. It’s a way for people to communicate with each other one-on-one as they digest shared experiences. Fans watching a Knicks game live on their TV at home might be texting each other with comments.
“This is more about questioning traditional notions than it is saying don’t do it anymore,” said O’Connell. “Because a live strategy needs to be a lot more expansive and sophisticated. You’ve got to be much more prepared to make real-time decisions. Your budgeting has to be more flexible. You need to be paying attention to social listening so you can get involved in conversation if it’s happening. There’s so much more depth and breadth to it.”
https://digiday.com/?p=580790
Who are these 20-somethings? What shapes their worlds, and how do they see themselves within it? Across the event, students explored the textures of contemporary life with sincerity, navigating themes of identity, transition, belonging and disquiet. The goal was not to present polished answers but to offer something truer: a multifaceted portrait of youth, made with honesty and complexity.
From the surreal to the intimate, the projects spanned emotional and technical registers. Fragments of Becoming by Riccardo Vacca (IED Roma) used a mix of AI, visual anthropology and analogue photography to explore the liminal space between adolescence and adulthood. In Bianco Latte, Valentina Doddato (IED Milano) created a quiet reverie of memory, where nature and domestic space melt into a landscape of suspended time. Meanwhile, In Between by Sofia Valabrega (IED Torino) captured the stasis and uncertainty that defines so much of young adult life today: the longing to move forward, tempered by the fear of getting it wrong.
Curators and course coordinators Giulia Ticozzi (IED Torino), Carlotta Cattaneo (IED Milano) and Daria Scolamacchia (IED Roma) described the event as “a participatory performance” in which the table served as a stage, inviting physical movement, informal critique and shared reflection. The process was designed to empower students not just to show their work but to actively shape the space around it.
In doing so, The Dreamers became more than an exhibition. It evolved into a live archive, constantly reshaped by those who engaged with it. By placing vulnerability and agency at the centre, IED offered a vision of arts education that feels refreshingly grounded: creative, yes, but also responsive, participatory and deeply human.
Global advertising expenditure has surpassed the $1 trillion mark for the first time.
Digital advertising continues to dominate this growth, with digital channels encompassing search and social media forecast to account for 72.9% of total ad revenue by the end of the year.
From a platform perspective, Google, Meta, Amazon, and Alibaba are expected to capture more than half of global ad revenues this year.
In-house and agency-side paid media teams are working harder than ever to grow ecommerce businesses efficiently, and the amount of data being used day-to-day (even hour-to-hour) is enormous.
With this growth and investment, something is clearly working, and given that brands can map new/returning audiences to their advertising funnel and serve ads across billions of auctions, it’s a lever that millions of businesses pull.
However, with budgets being split across channels (search, social, out-of-home, etc) and brands using CRM data, analytics platforms, third-party attribution tools, and more to define their “source of truth,” fragmentation begins to appear with reporting. Only 32% of executives feel they fully capitalize on their performance marketing data for this reason.
With data being spread across several sources, ad platforms having different attribution models, and the C-suite likely asking, “Which source of truth is correct?”, reporting paid media performance for ecommerce isn’t the most straightforward task.
This post digs into key performance indicators, platform attribution & modeling, business goals, and how to bring it all together for a holistic view of your advertising efficacy.
To begin navigating paid media reporting, it starts with the KPIs that each account optimizes towards and how this feeds into channel performance.
Each of these has purpose, benefits, limitations, and practical use cases that should be viewed through a lens of attribution unique to each platform.
This metric measures the revenue generated for every dollar spent on advertising.
If your total ad cost was $1,000 and you drove $18,500 revenue, your ROAS would be 18.5.
This metric shows the average cost to generate a sale (or lead, depending on the goal, e.g., an ecommerce brand could be measuring using CPA to sign up new customers for an event).
For example, if your total ad cost was $5,000 and you drove 180 sales, your CPA would be $ 27.77.
This metric measures what % of revenue is spent on advertising.
Say a brand spends $20,000 on Meta Ads and generates £100,000 in revenue, their resulting CoS would be 20%.
This metric may reflect either marketing costs associated with driving new customer acquisition or a holistic view of all costs associated with acquiring new customers.
Let’s say a business has a CAC of $175 and an AOV of $58, they will need each new customer to repeat purchase ~3x to make acquisition profitable.
This metric shows how efficiently your total ad spend is converting into revenue, regardless of the channel.
Where MER is especially useful is when brands are active on multiple ad networks, all of which contribute in some way to the final sale, and where siloed platform attribution is inconsistent.
Used alongside CAC, this metric is essential for understanding the true value of both acquisition and retention, which is important for almost all ecommerce models, and especially important for brands looking to capitalize on repeat purchases and subscription-based models.
So, which one should you be reporting on for your ecommerce brand?
Speaking from experience, there isn’t a right or wrong answer, nor is there a blueprint for which KPIs you should be reporting on.
Having a multifaceted approach will enable more informed decision making, combining short-, medium-, and long-term KPIs to form a holistic model for measuring performance that feeds into your reports.
However, even after choosing your KPIs, different attribution models across advertising platforms add another layer of complexity, as does the ever-evolving customer journey involving multiple touchpoints across devices, channels, etc.
Each ad platform handles attribution and tracking differently.
Take Google Ads, for example, the default model is Data-Driven Attribution (DDA), and when using the Google Ads pixel, only paid channels receive credit.
Then, with a GA4 integration to Google Ads, both paid and organic are eligible to receive credit for sales.
Click-through windows, value, count, etc, can all be customised to provide a view of performance that feeds into your Google Ads campaigns.
Using the Google Ads pixel, say a user clicks a shopping ad, then a search ad, and then returns via organic to make the purchase, 40% of the credit could go to shopping, and 60% to the search ad.
With the GA4 integrated conversion, shopping could receive 30%, search 40%, and organic visit 30%, resulting in 70% of the value being attributed back to the campaigns in-platform.
Now, comparing this to Meta Ads, which uses a seven-day click and one-day view attribution window by default, when a user converts within this time frame, 100% of the credit will be attributed to Meta.
This is why the narrative for conversion tracking on Meta is one of overrepresentation, with brands seeing inflated revenue numbers vs. other channels, even more so with loose audience targeting, where campaign types such as ASC can serve assets to audiences who have already interacted with your brand.
Then, when you dig into third-party analytics, the comparisons between Google Ads, Meta Ads, Pinterest Ads, etc., are almost the complete opposite.
So, what should this data be used for, and how does it factor into the bigger picture?
In-platform metrics are best viewed as directional.
They help optimize within the walls of that specific platform to identify high-performing audiences, auctions, creatives, and placements, but they rarely reflect the true incremental value of paid media to your business.
The data in Google, Meta, Pinterest, etc. is a platform-specific lens on performance, and the goal shouldn’t be to pick one or ignore these metrics.
It should be to interpret these for what they are and how they play into the overarching strategy.
KPIs such as ROAS and CPA offer immediate insights but provide a fragmented view of paid media performance.
To gain a comprehensive understanding, brands must combine medium- to long-term KPIs with broader modeling and tests that account for the multifaceted nature of performance marketing, while considering how complex customer journeys are in this day and age.
Introduced in the 1950s, MMM is a statistical analysis that evaluates the effectiveness of marketing channels over time.
By analyzing historical data, MMM helps advertisers understand how different marketing activities contribute to sales and can guide budget allocation.
A 2024 Nielsen study found that 30% of global marketers cite MMM as their preferred method of measuring holistic ROI.
The very short version of how to get started with MMM includes:
Unlike platform attribution, this doesn’t rely on user-level tracking, which is especially useful with privacy restrictions now and in the future.
From a tactical standpoint, your chosen KPIs will still lead campaign optimizations for your day-to-day management, but at a macro level, MMM will determine where to invest your budget and why.
Instead of relying on attribution models, this uses controlled experiments to isolate the impact of your paid media campaigns on actual business outcomes.
This kind of testing aims to answer the question, “Would these sales have happened without the paid media investment?”.
This involves:
This isn’t one that’s run every week, but from a strategic point of view, these tests help to validate the actual performance of paid media and direct where and what spend should be allocated across ad platforms.
These are equally as important (if not more) for ecommerce reporting and absolutely need to be considered when setting KPIs and beginning to think about modeling, testing, etc.
Without considering these factors, brands will use inaccurate data from the get-go.
Think about the impact of buy now, pay later. Providers such as Klarna or Clearpay can lead to higher return rates, as bundle buying and impulsive purchases become more accessible.
Without considering operational factors, using this example and a basic in-platform ROAS, brands would be optimizing toward incorrect checkout data with higher AOV’s and no consideration of returns, restocking, etc.
Ultimately, building a true picture of paid media performance means stepping beyond the platform KPIs and metrics to consider all factors involved and how best to model the data to uncover not just “what” is happening, but “why” it is and how this impacts the wider business.
No single tool or model tells the full story.
You’ll need to compare platform data, internal analytics, and external modeling to build a more reliable view of performance.
The first step is getting watertight KPIs nailed down that consider every possible operational factor so you know the platforms are being fed the correct data, and if you need to modify these based on platform nuances due to differing attribution models, do it.
Once these are nailed down, find a model that you trust and that will show you the holistic impact of your paid media spend on overall business performance.
You could explore the use of third-party attribution tools that aim to blend data together, but even with these, you’ll still require clear and accurate KPIs and reliable tracking.
Then, when it comes to the visual side of reporting, the world is your oyster.
Looker Studio, Tableau, and Datorama are among the long list of well-known platforms, and with most brands using three to four business intelligence tools and 67% of analysts relying on multiple dashboards, don’t stress if you can’t get everything under one lens.
When all of this is executed and made into a priority over the short-term ebbs and flows of paid media performance, this is the point where connecting media spend to profit begins.
More Resources:
Featured Image: Surasak_Ch/Shutterstock
As FIFA Club World Cup observers fret about ticket sales, Warner Bros. Discovery shares no such concerns about the event’s ads.
TNT Sports has partnered with DAZN on a sublicense for English-language coverage of the event, broadcasting 24 matches on its TNT, TBS, and TruTV channels—with all 63 matches streamed on DAZN from June 14 through July 13.
According to Jon Diament, WBD’s evp of ad sales, ad inventory for the TNT Sports slate of matches is “virtually sold out” heading into its June 14 kickoff between Lionel Messi’s Major League Soccer (MLS) side Inter Miami and Egyptian Premier League team Al Alhy at 8 p.m. ET on TBS.
“The upfront had a lot of live sports increases, and the second quarter of this year has just been terrific,” Diament said. “I think if you’re an advertiser, you’re looking for reach, engagement, the live nature of sports, multiplatform—all those things keep reiterating the value of live sports in the second quarter, and that got us into a sellout position.”
Diament mentioned that TNT Sports already strong ad sales during the quarter from college basketball’s March Madness, both the NHL and NBA playoffs, and the company’s inaugural domestic broadcast of the French Open at Roland-Garros, which not only sold out its ad inventory but saw a 25% increase in viewership from a year earlier.
Some of that second-quarter success came from official partners of professional leagues gravitating toward playoff season, Diament noted, but also from strong scatter demand for live sports. For TNT Sports’ Club World Cup coverage, for example, ad inventory was picked up by FIFA partners including Visa, Bank of America, and Michelob Ultra—which sponsors post-match coverage and the Superior Player of the Match—but also by other brands including Vanda Pharmaceuticals (halftime and half highlights), DraftKings (pregame odds and promo), Verizon (studio club profiles), Lowe’s, Apple, Heinken, Adidas, Nike, Starbucks, Amica, JP Morgan Chase, and even Mas+ by Messi.
“Most of the FIFA sponsors took advantage of the new tournament,” Diament said. “We have a combination of official partners, but also, because we’re TNT Sports and we’re not DAZN or FIFA, we can go to the overall market.”
Through the partnership with DAZN, TNT Sports has been able to offer those advertisers more in-game options, including two-box ad presentation (or squeeze back) during player substitutions, water breaks or other pauses in the action, and a game-clock feature that lets a brand take over all on-screen graphics for 10 seconds before putting its logo next to the clock for two minutes.
But TNT Sports sees opportunity in its digital and social media platforms for Bleacher Report and House of Highlights, which enhanced its Roland-Garros coverage a few weeks ago by bringing sports figures like Odell Beckham and Derrick Rose in for cameos and commentary. Diament noted that TNT Sports’ coverage of U.S. Soccer and its work with veteran soccer talent like analysts Luke Wileman, Brian Dunseth, and Melissa Ortiz have made it familiar with soccer’s younger viewership in the U.S. and helped its broadcast and social strategy to a daylong event not dissimilar to March Madness or Roland-Garros.
That monopoly on fans’ attention hasn’t gone unnoticed by event advertisers.
“There’s a lot of push notifications, people signing up for what they’re interested in, they have a good feeling for how to create excitement before and after the matches themselves,” Diament said. “This is one of the great things about social media, it’s 24/7 and it’s just not when the live games are happening, so people are carrying around their phones and that younger demo stays connected.”
Why you can trust Creative Bloq
Our expert reviewers spend hours testing and comparing products and services so you can choose the best for you. Find out more about how we test.
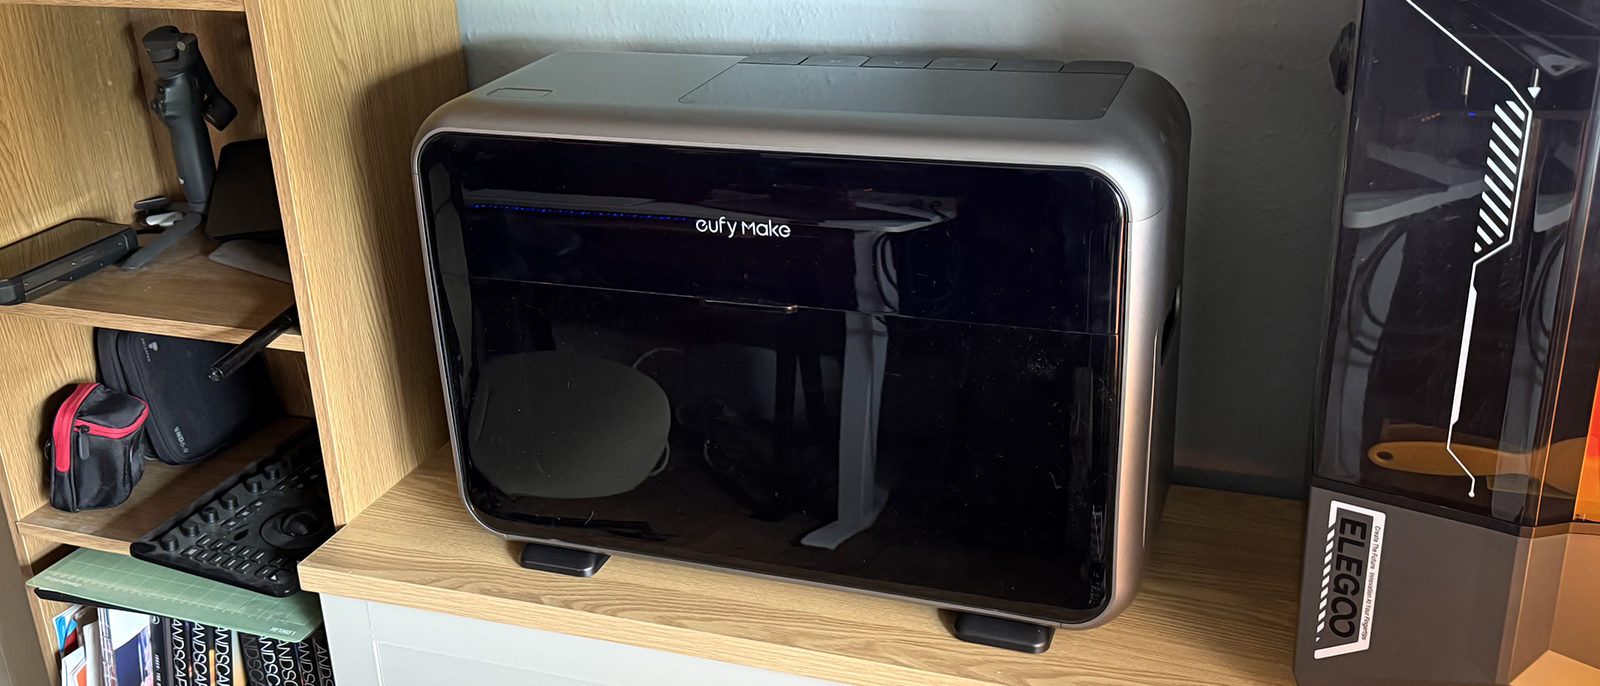
Printers get a lot of the spotlight and rightly so. 2D printers have been around for so long that not much has moved on with the technology in a long time. Things are changing, though, and eufyMake is leading the charge with its eufyMake E1 UV printer. Billed as a business in a box, this printer allows you to print images on just about any material you care to think of, from wood to metal. Not only that, but it promises to print on multiple shapes, from the perfectly flat to completely round, like glasses and coffee cups. To make the E1 even more appealing, it can also print with depth, add a gloss finish and much more.
For makers, creators and artists, this opens up a whole world of possibilities, from selling more individual prints to merch, assuming the E1 delivers.
You may like
Inks and cleaning kit are included (Image credit: Rob Redman)
Everything is ready to go out of the box (Image credit: Rob Redman)
Texture printing, with brush stroke generation is very good (Image credit: Rob Redman)
The E1 prints easily on rough or uneven surfaces (Image credit: Rob Redman)